Insights
Q2 2026 Quarterly Newsletter


0 min read
Dear Friends and Clients,
Three months ago we wrote to you in the middle of a crisis. The Strait of Hormuz was closed, oil had passed $100 a barrel, and the first quarter had ended in the red. We told you then that we believed the selloff was a repricing of risk rather than a repricing of value, and that patient investors would be rewarded.
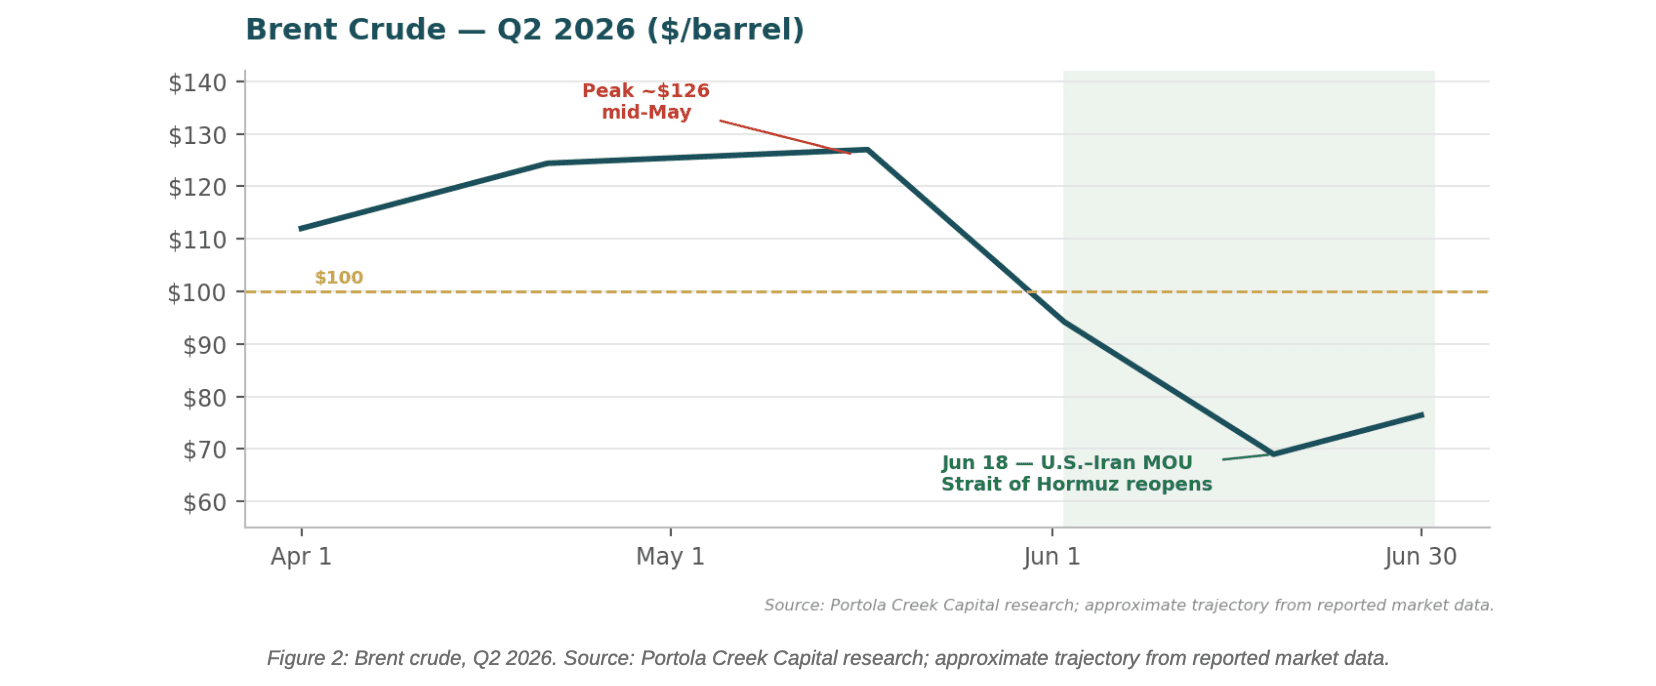
The second quarter delivered — emphatically. The S&P 500 returned 15.2%, its best quarter in six years. The Nasdaq 100 posted its second-best quarterly performance in twenty-five years. Small caps did even better, with the Russell 2000 up 21.5%. Brent crude peaked near $126 in May and then collapsed below $70 within weeks after the United States and Iran signed a memorandum of understanding on June 18 that reopened the Strait.
We want to be careful about the lesson drawn from this. The rally was not simply relief. Underneath it sat something more durable, and it is the central subject of this letter: corporate earnings grew faster in the second quarter than in any quarter since 2021. Markets did not merely recover from fear. They were paid to.
But the world that emerged from this quarter is not the world that entered it. A ceasefire is not a settlement, alliances have been rearranged, and the assumptions underpinning global energy trade have been rewritten in ways that will outlast any single agreement.
The Quarter at a Glance
The second quarter was, in the simplest terms, the mirror image of the first. Where Q1 was a geopolitical shock that overwhelmed good fundamentals, Q2 was the unwinding of that shock on top of fundamentals that had continued to improve throughout. Both the S&P 500 and the Nasdaq 100 recorded their strongest quarterly performance in six years.
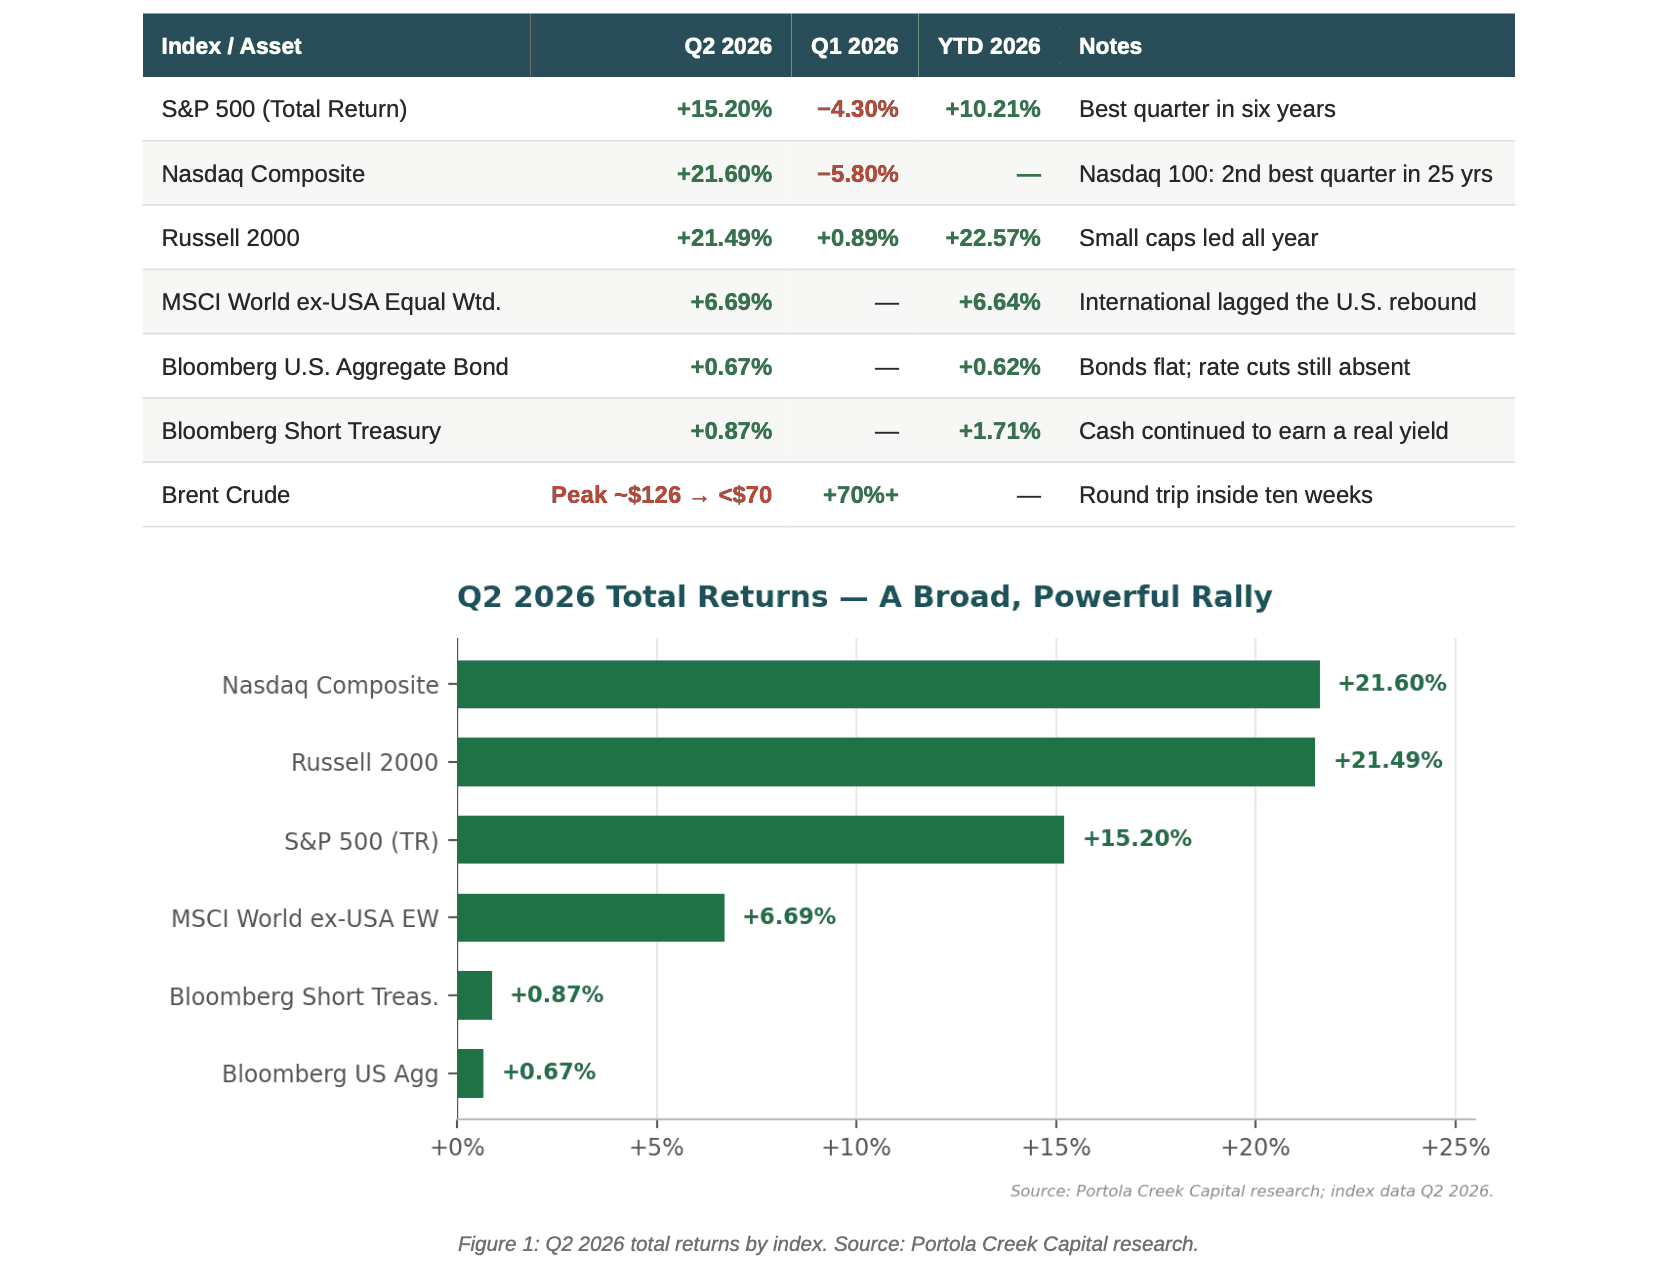
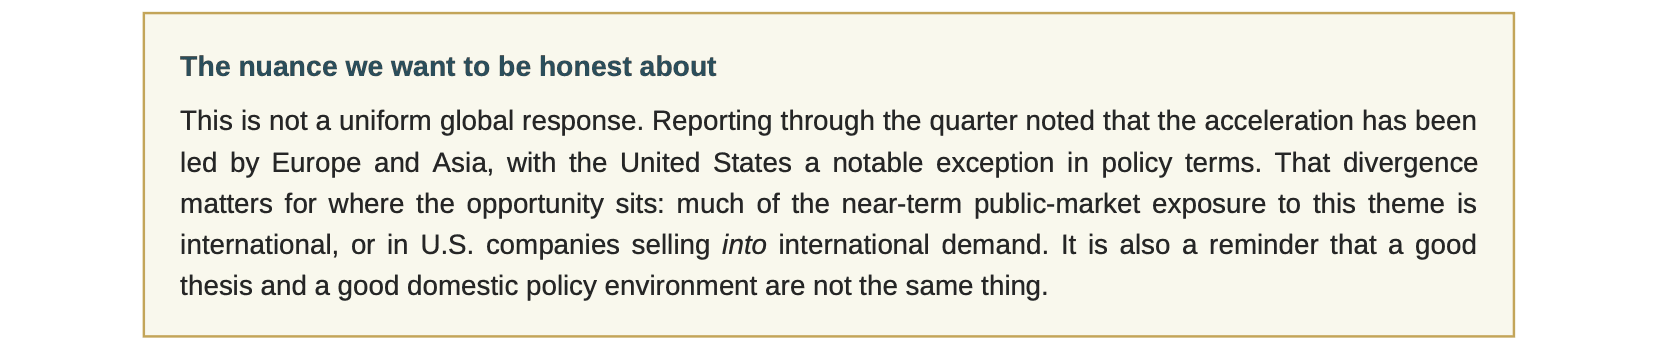
Two observations are worth drawing out. First, the rally was broad. This was not seven stocks carrying an index. Small caps outperformed large caps, and ten of eleven S&P 500 sectors grew earnings year over year. Breadth of that kind is generally a sign of health rather than froth.
Second, the round trip in oil was extraordinary in both directions. Brent traded from above $126 in mid- May to below $70 by late June — roughly ten weeks. In hindsight that was an opportunity twice over: selling energy into the May peak and buying it back at the June trough would each have been handsomely rewarded.
We would gently resist the conclusion that it was therefore a trade to have made. The turn did not come from a discernible shift in supply or demand that a diligent analyst might have seen building. It came from the signing of a diplomatic memorandum on a date that was not knowable in advance. Capturing both ends required being right about the timing of a negotiation between two governments — twice, in opposite directions. That is a different skill from investing, and we do not claim it. What the quarter demonstrated is not that geopolitical trading is costly; it is that its rewards accrue to correct guesses about diplomacy, which is not a repeatable process.
What Actually Repriced
It is tempting to describe the quarter as markets "recovering." That is not quite what happened. What was repriced was the probability distribution of geopolitical outcomes, and it moved in two distinct steps.
Through April and May, markets carried a large war premium: crude above $100, elevated freight and insurance costs, and a persistent discount applied to anything with Gulf supply-chain exposure. When the June 18 memorandum was signed and tanker traffic resumed through the Strait, that premium came out almost at once. Analysts cut 2026 Brent forecasts for the first time in five months — the Reuters survey of thirty-one economists reduced its 2026 average from $90.44 to $84.50 in a single monthly revision.
The second step is subtler and, we think, more important. Even as the war premium unwound, a structural premium did not. Shipping insurance for the region has not returned to pre-conflict levels. Chevron's chief executive described risks across the Strait of Hormuz, the Red Sea, and the Black Sea as "very real" in early August, with the company exploring routes that bypass Middle East chokepoints entirely. Gulf producers are committing capital to bypass pipelines. That is not a market pricing a resolved conflict. It is a market pricing a permanently higher cost of moving hydrocarbons through contested water.

Is the War Over? The Honest Answer is: Not Exactly
A ceasefire took effect on April 8. A memorandum of understanding between the United States and Iran followed on June 18, reopening the Strait. Both were genuine de-escalations, and markets responded accordingly.
Then, in July, the ceasefire was publicly declared over — though not, according to the same statements, a return to full-scale war. Houthi activity has continued to threaten Red Sea and Bab el-Mandeb transit. As of early August the conflict has entered its sixth month, global inventories have been drawn down, and the phrase used by industry leadership to describe conditions is "fragile and uncertain."
We say this plainly because we think the alternative framings are both wrong. This is not a resolved conflict, and it is not an ongoing catastrophe. It is an unstable equilibrium — and the most consequential thing about it is not whether it holds, but what the world has already built in anticipation that it might not.
The Institutions Are Changing Shape
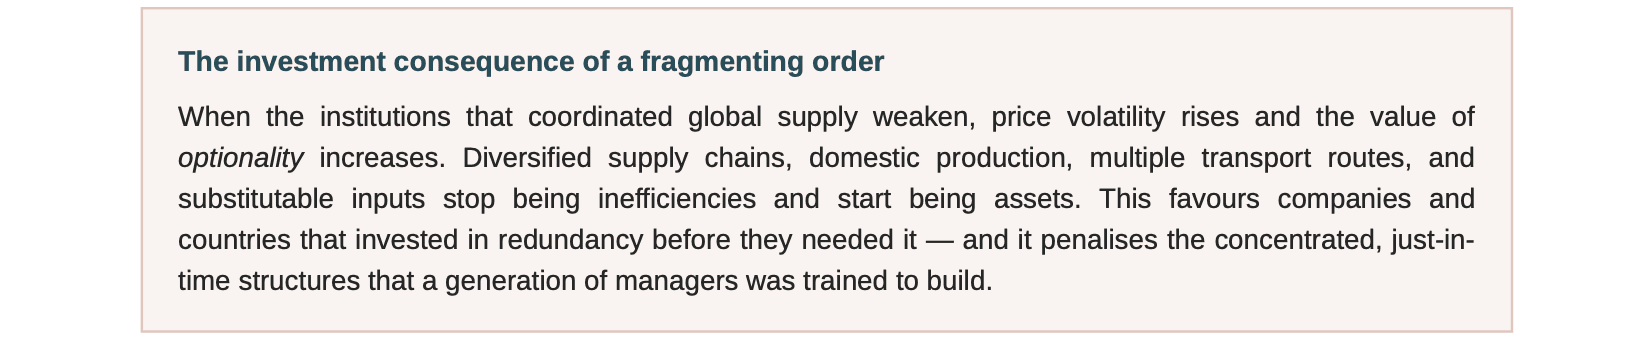
The most underappreciated development of the quarter received a fraction of the coverage that oil prices did: the United Arab Emirates announced its withdrawal from OPEC+ in May. For an alliance whose entire function is collective supply management, the departure of a major producer at the precise moment supply discipline mattered most is a structural event, not a headline. Analysts have described it as an inflection point in the erosion of producer coordination.
Alongside it, a broader rearrangement of agreements:
• Gulf export strategy is being rebuilt around the Strait rather than through it. The UAE has announced $55 billion in new project awards for 2026–28 and called for accelerated delivery of a bypass pipeline due online in 2027. Oman is actively marketing its geographic position outside the Strait as a competitive advantage in its bid rounds — a selling point that did not exist eighteen months ago.
• The losers are those with no alternative. Kuwait, which has no export route outside the Strait, has effectively suspended its capacity expansion program and foreign investment drive. Iraq was forced to shut in all but roughly 1 million barrels per day, resuming only modest volumes through Turkey and overland via Syria.
• Shipping has rerouted at scale. Traffic around the Cape of Good Hope has risen sharply, boosting African port activity and permanently lengthening voyage economics for Asia-Europe trade.
• Gulf states are changing what they export. Saudi Arabia's NEOM green hydrogen project and the Saudi– Egypt electricity interconnection reflect a pivot toward exporting electrons and hydrogen rather than only barrels. The UAE has launched a large integrated solar-and-battery facility capable of continuous output. These are producers hedging their own product.
The IEA has identified damage ranging from moderate to severe at more than thirty energy facilities across the region. Some of that capacity will not return quickly — roughly 17% of Qatar's LNG capacity is reported offline for at least three years.
Trade Policy: The Mechanism Changes, The Direction Does Not
We wrote last quarter that the Supreme Court's January ruling against tariffs imposed under the International Emergency Economic Powers Act had not changed the administration's trade posture — only the legal instrument. The second quarter confirmed that reading. Duties have been maintained through alternative authorities and new Section 301 investigations, and supply chains continue to reorganize around regionalization and friend-shoring.
For portfolios, the practical implication is unchanged and now well tested: companies with diversified sourcing and genuine pricing power have absorbed tariff costs; those with concentrated exposure to affected routes and thin margins have not.
The Fed: Still on Hold
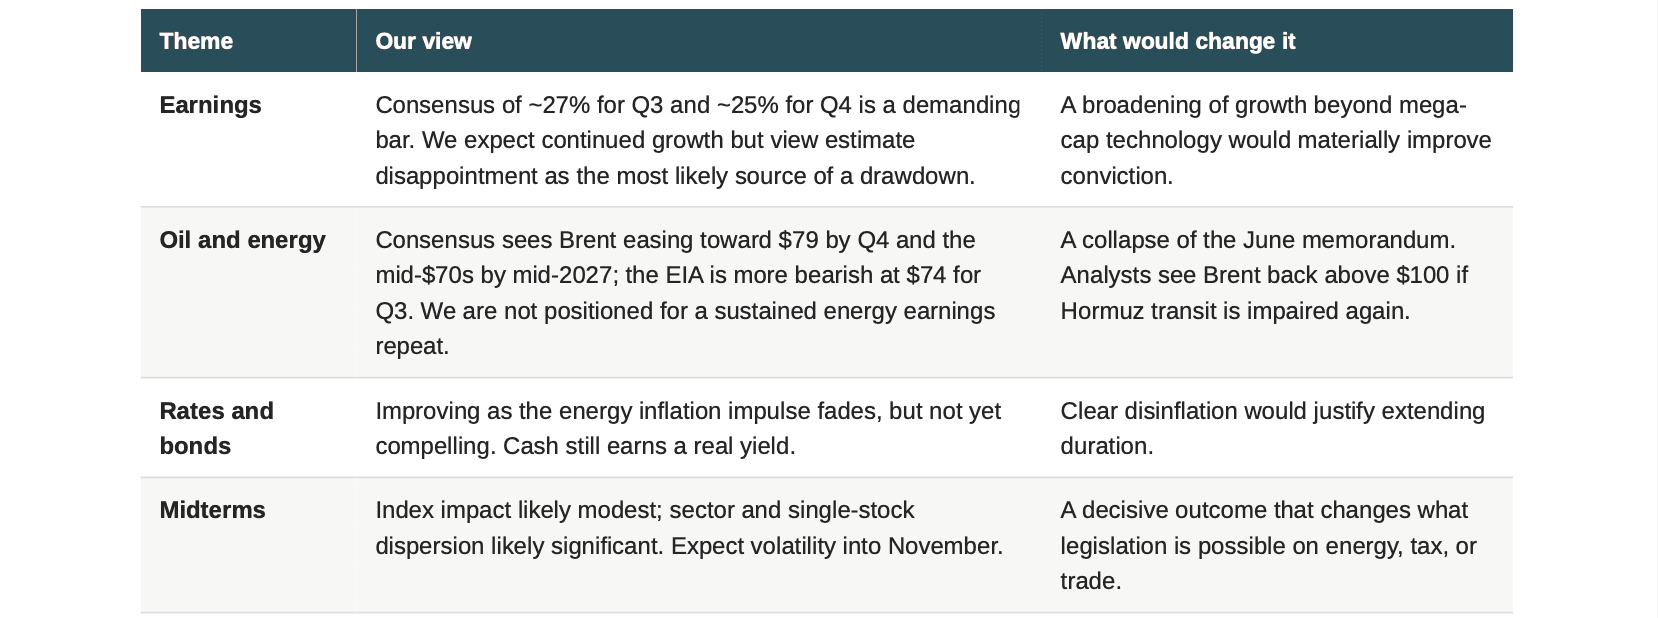
Markets entered 2026 pricing two to three rate cuts. The energy shock erased them. With Brent having round- tripped and the inflation impulse from oil fading, the debate has reopened — but bonds returned only 0.67% in the quarter, and cash continued to earn a positive real yield. We would characterise the fixed income opportunity as improved but not yet compelling, and we have not extended duration aggressively.
November 3: What the Midterms Do and Do Not Mean
All 435 House seats and 35 Senate seats are contested on November 3. Republicans enter holding narrow majorities — as of mid-July, 218 House seats to 212, and 53 Senate seats to 45 plus two independents caucusing with Democrats. Early voting data has indicated stronger Democratic enthusiasm.
Here the analyst community divides in an instructive way, and we think both sides are partly right.

The reconciliation is straightforward: the index is unlikely to care much; individual holdings may care a great deal. That is an argument for attention to position-level policy exposure, not for reducing equity risk ahead of a vote.
On seasonality, one pattern is worth noting without over-weighting it. The bulk of midterm-year market pressure has historically occurred in the first three quarters, with markets tending to turn around October. Research from Carson has found that the six months following a midterm election — November through April — have historically been the strongest stretch of the four-year presidential cycle, averaging roughly 14% for the S&P 500. History is context, not a forecast, and we would not position on it alone.

The Correlation That Matters Most
If you take one analytical point from this letter, we would like it to be this one. Over any meaningful horizon, equity returns track earnings growth more closely than they track any other single variable — more than interest rates, more than sentiment, and far more than politics. Valuation multiples determine when you are paid. Earnings determine whether you are paid at all.
The second quarter is an unusually clean illustration. Consensus entered the quarter expecting S&P 500 earnings growth of 18.8%. By the time reporting began that had risen to 23.6% — the highest pre-season estimate since 2021 — an increase that runs directly counter to the normal pattern in which analysts cut estimates by roughly 4% through a quarter. Companies then beat those raised expectations. Early in the season, 88% of reporters exceeded EPS estimates against a five-year average of 78%, and in aggregate they beat by 16.4% against a five-year average of 7.0%.
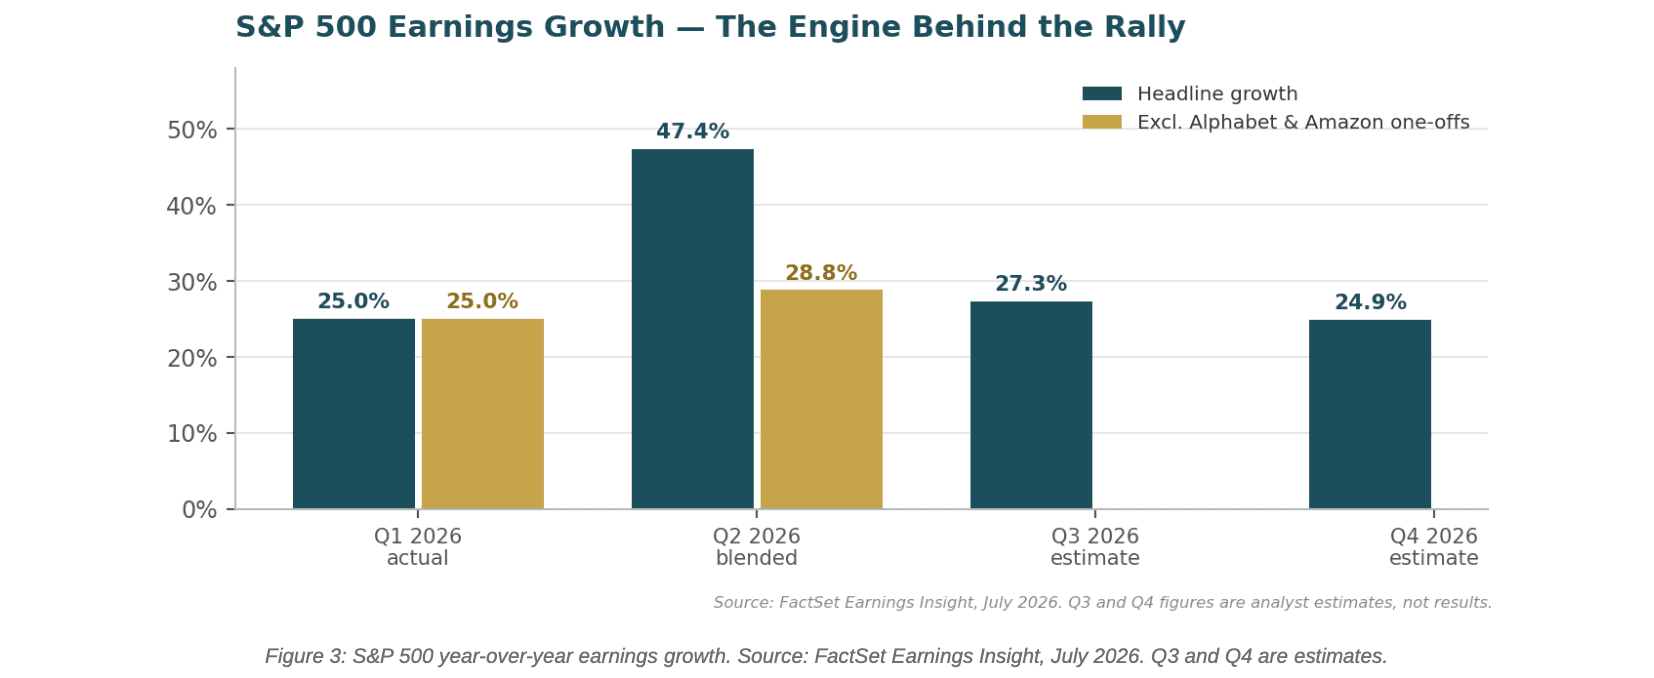
The blended growth rate for the quarter reached 47.4%, which would be the highest since Q2 2021. That headline number requires an important qualification, and we would rather give it to you than let you find it elsewhere: it is inflated by one-off gains, including a $98 billion item at Alphabet and a very large earnings surprise at Amazon. Excluding those two companies, growth was 28.8% — still the second consecutive quarter above 20% and the seventh consecutive quarter of double-digit growth. The underlying picture is strong without the distortions. We simply do not think 47% is the right number to carry forward.
Where the Growth Came From

Ten of eleven sectors grew earnings. Energy led at roughly 135% on the oil price spike — a figure that will not repeat, since it is measured against a quarter when Brent averaged $68. Communication Services and Consumer Discretionary follow, both flattered by the one-off items noted above. Information Technology and Materials posted genuine double-digit strength. Health Care was the only sector to decline.
Revenue growth tells a cleaner story than earnings, because it is harder to distort: all eleven sectors grew revenues, and the index rate of roughly 13% would be the highest since 2022.
Valuation: Fuller, Not Extreme
The S&P 500's forward twelve-month P/E stood at 20.4 at quarter end and around 20.1 in late July — above the five-year average of 19.9 and the ten-year average of 19.0, but not dramatically so. For context, the index traded near 25 times forward earnings at the peak of the dot-com era.
The distinction that matters is why the market has risen. Much of 2026's advance has been supported by improving profitability rather than by multiple expansion. That is a materially healthier foundation than the alternative. It also sets a demanding bar: consensus calls for roughly 27% growth in Q3 and 25% in Q4, with full-year 2026 growth around 24–27%. Those are large numbers to clear, and disappointment against them is the most likely source of a drawdown in the second half — more likely, in our view, than any geopolitical or electoral catalyst.
A Thesis Now Being Executed With Capital
Last quarter we argued that Hormuz had converted the energy transition from a climate argument into a security argument. In the second quarter, that conversion showed up in budgets. A few concrete examples, because we think specifics are more persuasive than themes:
France unveiled its most sweeping electrification plan to date — doubling annual electrification funding to €10 billion, banning gas boilers in new buildings, and targeting two of every three new cars sold to be electric by 2030.
Spain offers the clearest evidence that prior investment pays under exactly these conditions. Its wind and solar buildout has cut the share of hours in which gas sets the domestic power price from 75% in 2019 to 19% in 2025. During the Hormuz shock, wholesale power in Germany and Italy ran well above €150/MWh while Spain's 2026 average is projected at €60–70/MWh.
Consumer behavior moved before policy did. Across Europe, online searches for electric vehicles, heat pumps, and residential solar hit record highs in the weeks after the closure.
Capital allocators have repriced the sector. A survey by the UK Sustainable Investment and Finance Association of firms managing roughly $7.4 trillion found that 87% expect renewable energy project financing to increase following the conflict.
The Gulf producers themselves are hedging. Saudi Arabia's NEOM green hydrogen project, the Saudi– Egypt electricity interconnection, the UAE's integrated solar-and-battery facility, and Saudi plans for rapid battery storage expansion all point the same direction.
Scale check. The record solar and wind capacity added globally in 2025 alone — roughly 510 GW of solar and 160 GW of wind — generates an estimated 1,100 TWh per year. That is approximately twice the electricity that would have been produced from all the LNG that transited the Strait of Hormuz before the closure.
Energy analysts have taken to calling this "Asia's Ukraine moment," and the parallel is apt. Europe's response to the 2022 gas shock was not a temporary substitution — it was a permanent restructuring that left it measurably better positioned when the next shock arrived. Asia is now making the same calculation on a larger base of demand.
The Question Being Asked
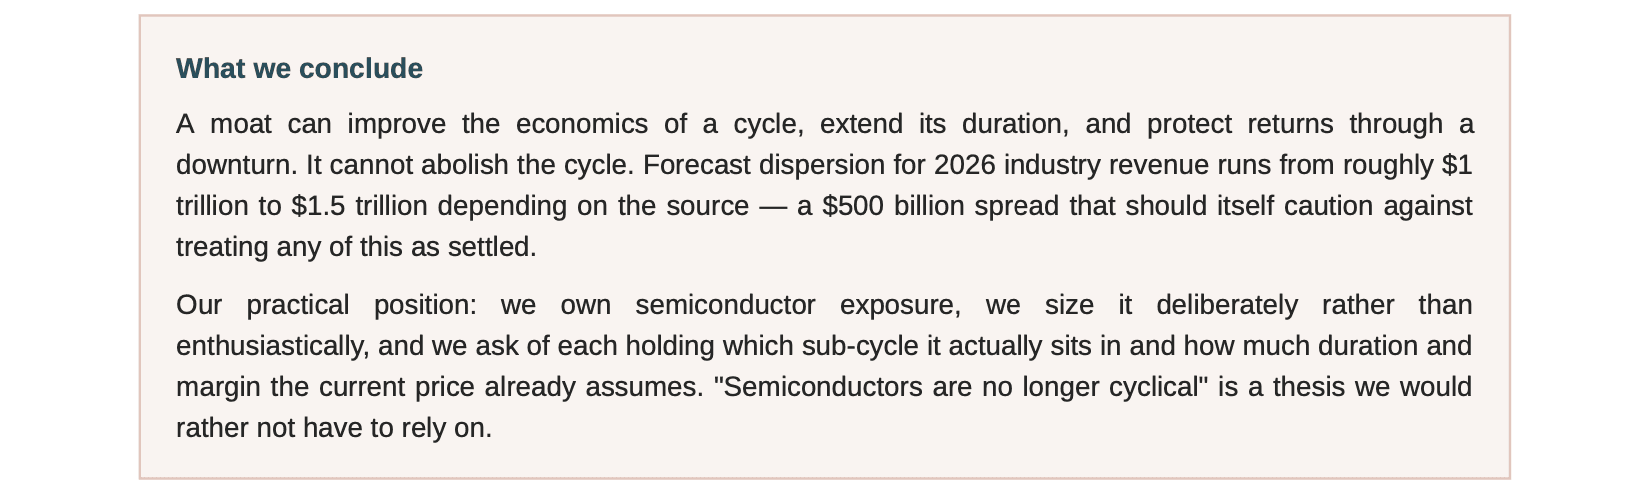
It has become fashionable to argue that semiconductors have ceased to be cyclical — that AI has converted a boom-and-bust commodity industry into a structural growth sector. The case is not frivolous. Chips have become foundational to computing, defence, electrification, and industrial automation simultaneously. One European strategist put it memorably: the chip is the new steel.
The supporting data is real. SK Hynix reached an all-time high for the first time since the late 1990s, breaking a decades-long boom-bust pattern. Micron's entire 2026 high-bandwidth memory supply sold out, removing precisely the revenue uncertainty that historically compressed memory valuations. Hyperscale capital expenditure passed $100 billion in a single quarter for the first time in late 2025, and the largest four are expected to raise capex by roughly 70% in 2026. IDC forecasts data center semiconductors reaching $477 billion in 2026 and $843 billion by 2030 — nearly half the total market.
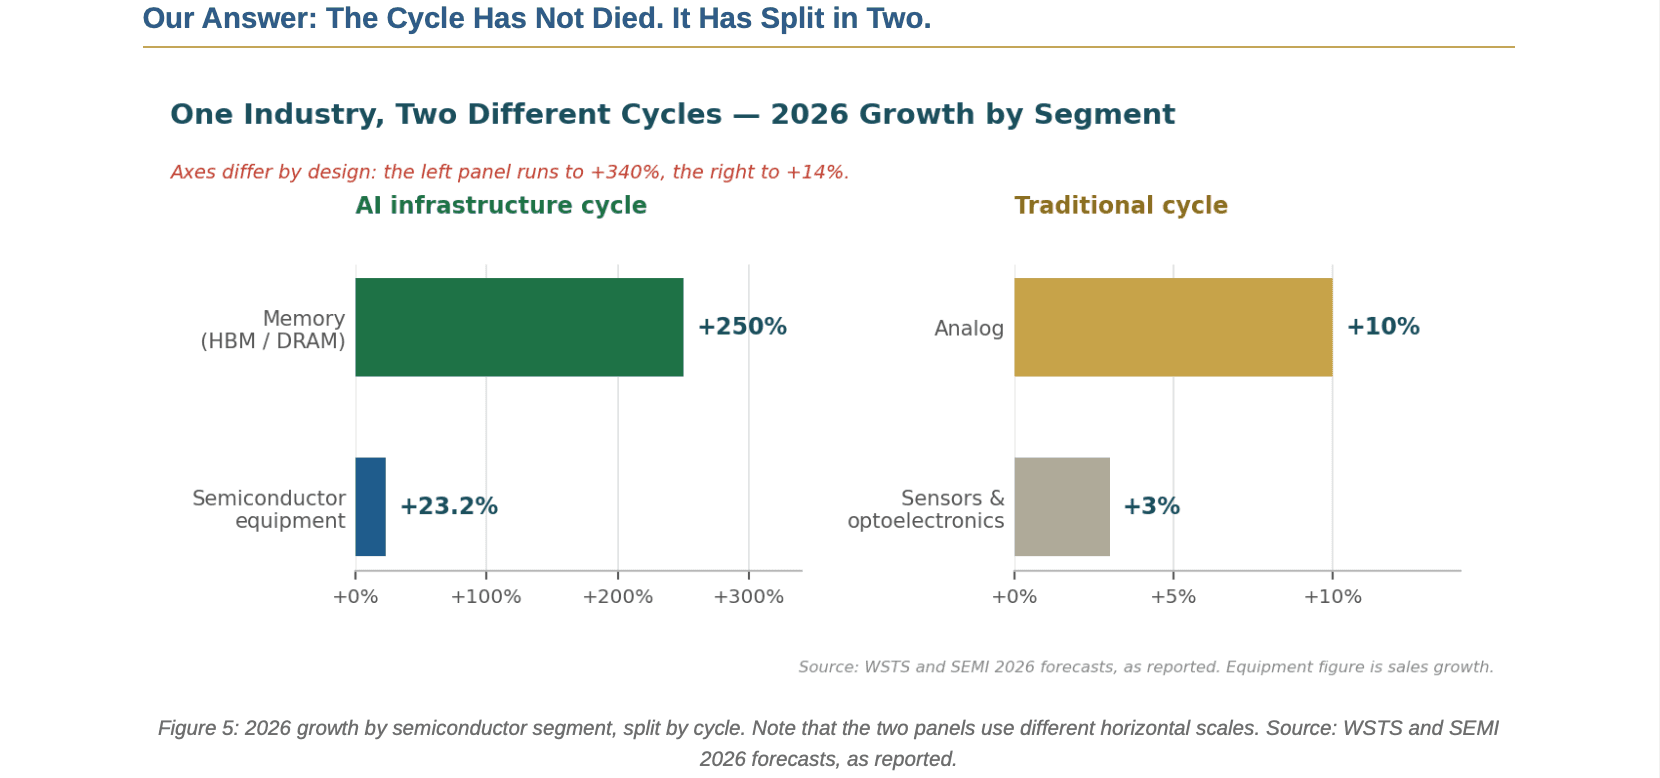
The most useful framing we encountered this quarter is that AI has not abolished semiconductor cyclicality — it has desynchronised it. Look at the dispersion within a single industry in a single year: memory is forecast to grow roughly 250%, semiconductor equipment sales 23%, analog 10%, and sensors and optoelectronics 3%.
Those are not four readings of a single cycle. They are two distinct systems running at different speeds — an AI infrastructure cycle and a traditional cycle — with different sub-cycles inside each. Leading-edge logic, HBM, advanced packaging, networking, and test are in a capacity-constrained expansion. Analog, automotive, industrial, mature-node, PC, and smartphone demand sit at entirely different points — automotive demand remains weak with recovery likely delayed to 2027, while industrial has entered a restocking phase after a long inventory correction.
It is also worth noting that a meaningful share of 2026 growth is coming from price rather than volume. DRAM prices are projected up 70–100% against 2025 levels. Rising prices in a shortage are not the same thing as structurally higher demand, and the distinction tends to be forgotten near cycle peaks.
The Constraint Has Moved
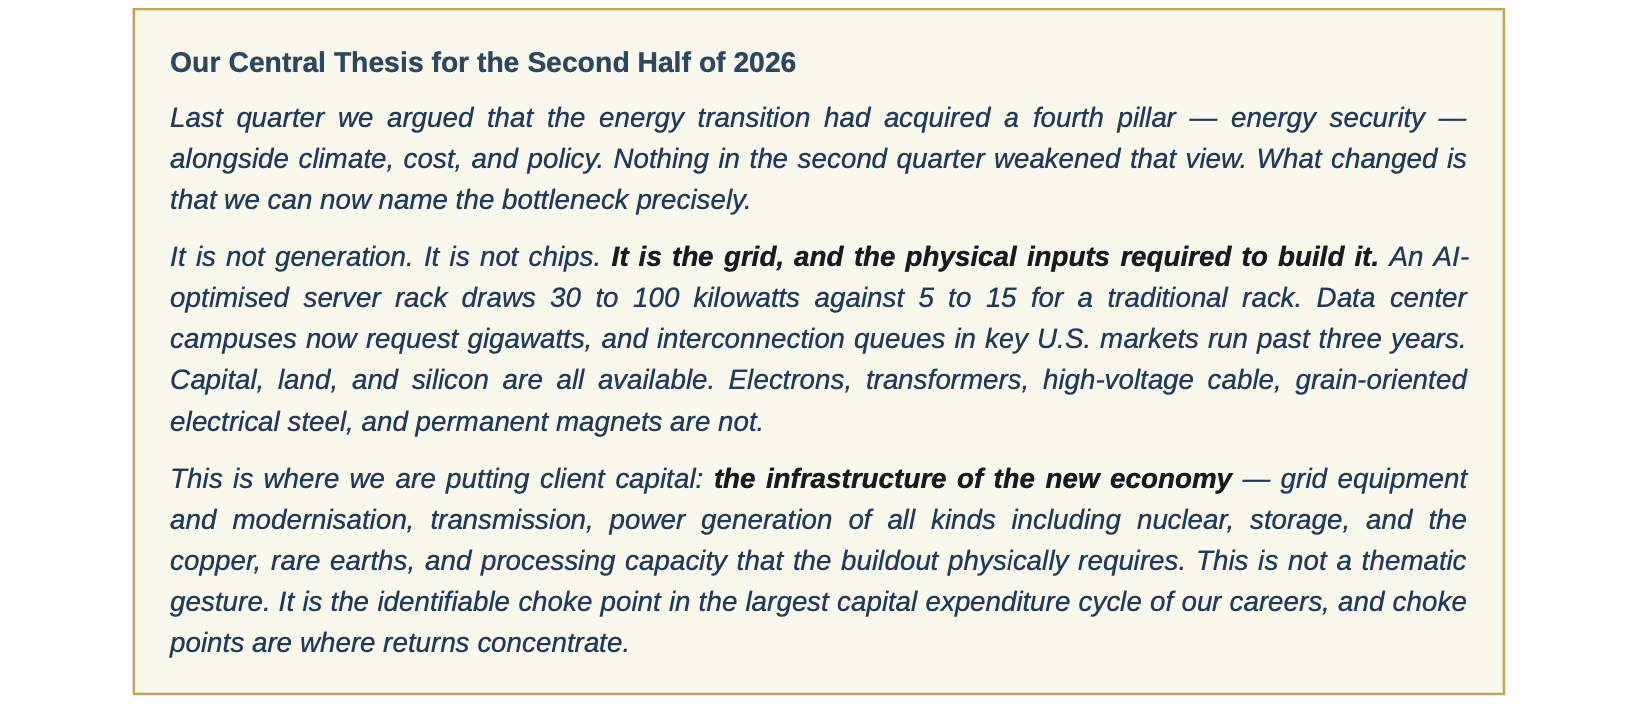
Through 2024 the binding constraint on AI was GPUs. Through 2025 it was capital and cooling. In 2026 it is neither. It is electricity, and the physical apparatus required to deliver it.
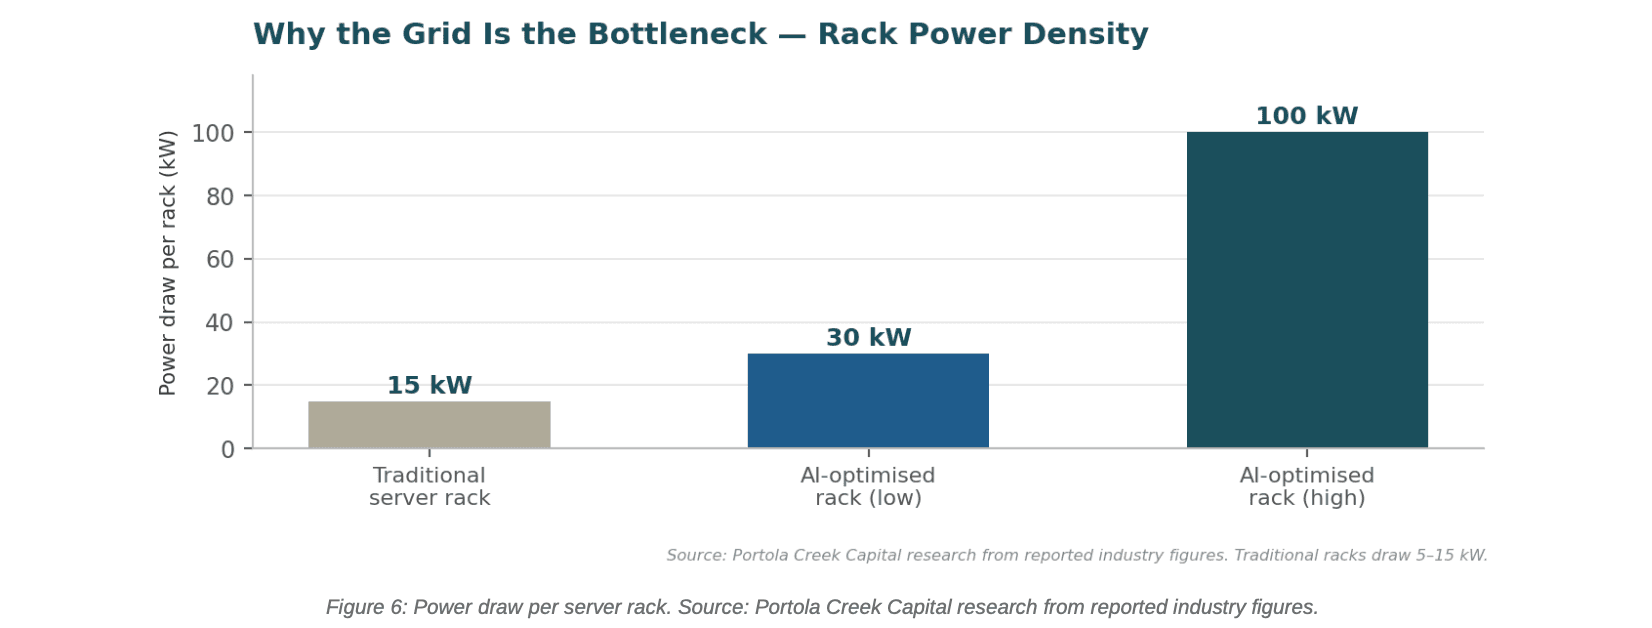
The arithmetic is unforgiving. A traditional server rack draws 5 to 15 kilowatts. An AI-optimised rack draws 30 to over 100. That density overwhelms local substations designed for a different era. New campuses now request power at genuine utility scale — two projects in Wisconsin alone sought a combined 3.9 gigawatts — and interconnection delays in key U.S. markets exceed three years. A developer with financing secured, permits approved, and crews ready can still be told the connection date is 2029.
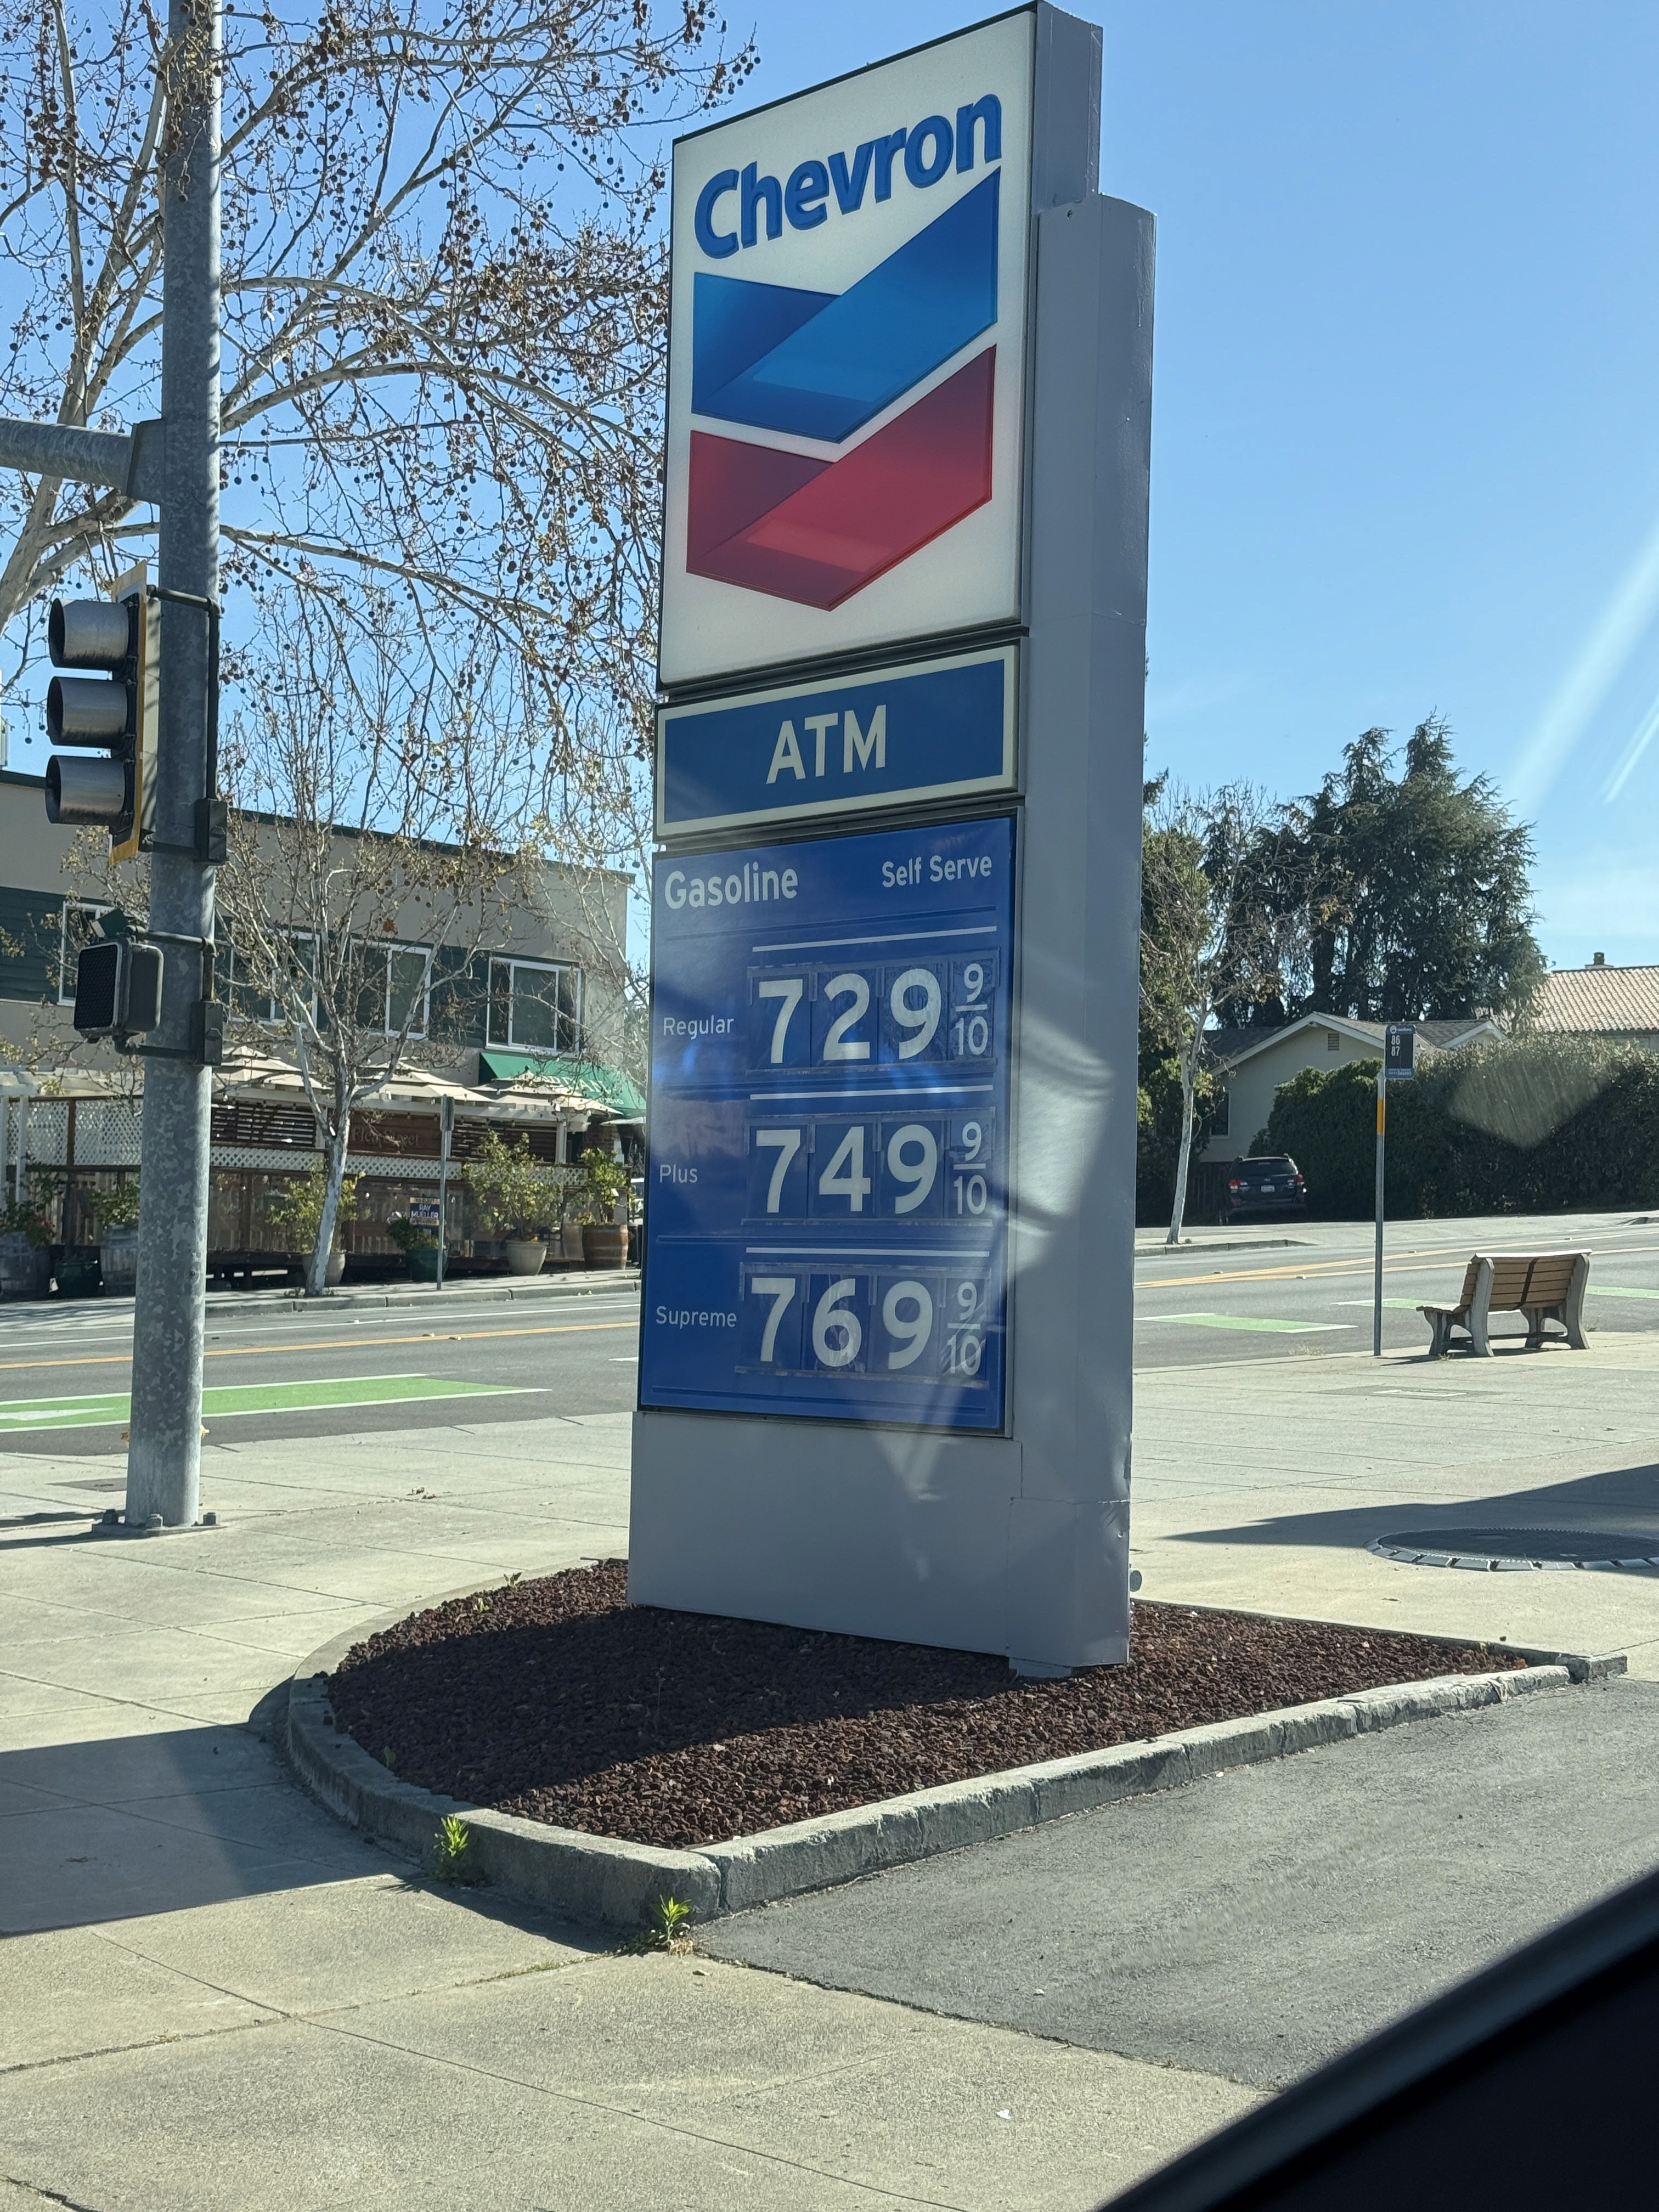
The response is already visible in industry behaviour. GE Vernova expected to end 2025 with roughly 80 gigawatts of gas-turbine backlog and slot reservations extending into 2029, with management guiding toward being sold out through 2030 by the end of this year. Chevron signed a twenty-year, 2.67-gigawatt behind-the- meter power purchase agreement with Microsoft for a West Texas data center. When a data center operator contracts directly with an oil major for two decades of dedicated generation, the grid constraint has stopped being a forecast.
Minerals: The Constraint Behind the Constraint
Building grid capacity requires physical inputs that cannot be conjured on a software timeline. Recent peer- reviewed work modelling mineral demand from AI data centers through 2035 reaches a conclusion we find compelling: copper dominates total modelled mass, with grid transmission and distribution accounting for the largest share of demand, and grain-oriented electrical steel — the material transformer cores are made from — emerges as a particularly constrained enabling material.
Critically, that research identifies processing and refining capacity, not geological scarcity, as the greatest supply risk. The metal is in the ground. The capacity to refine it into usable form is concentrated, and in several cases concentrated in a single jurisdiction. China accounts for roughly 70% of global rare-earth mine production and approximately 90% of processed rare earths and permanent magnets, and Beijing expanded export licensing requirements in late 2025 to cover products containing Chinese rare earths even when processed abroad.
Copper reached an all-time high of $13,387 per tonne on the LME in January 2026, following a 42% gain in 2025 — its best year since 2009. Major new mining projects routinely take a decade from discovery to meaningful production, so supply responds to demand shocks in years, not quarters.
Rare earths and permanent magnets are the smaller-volume, higher-leverage constraint. NdFeB magnets enable the high-efficiency cooling and power systems inside data centers. Small disruptions here create large bottlenecks.
Gallium, germanium, graphite, lithium, and cobalt share the same processing-stage vulnerability.
Recycling is becoming a genuine supply source. Microsoft has invested in rare-earth recovery from hard drives, and a feasibility study is underway for a $125 million U.S. rare-earth magnet recycling facility.
U.S. policy has shifted materially. Federal support now combines direct investment, loans, grants, and long-term purchase agreements aimed at rebuilding a domestic supply chain — meaningfully changing the risk profile for domestic producers.
What We Expect to Drive Returns
Our base case for the second half is constructive but distinctly less exuberant than the second quarter would suggest. The rally was earned, and the earnings behind it are real. But three things are true at once: the easy comparisons are behind us, the consensus bar for the second half is high, and the oil tailwind that lifted the largest earnings contributor in Q2 is expected to become a headwind.

What We Are Adding
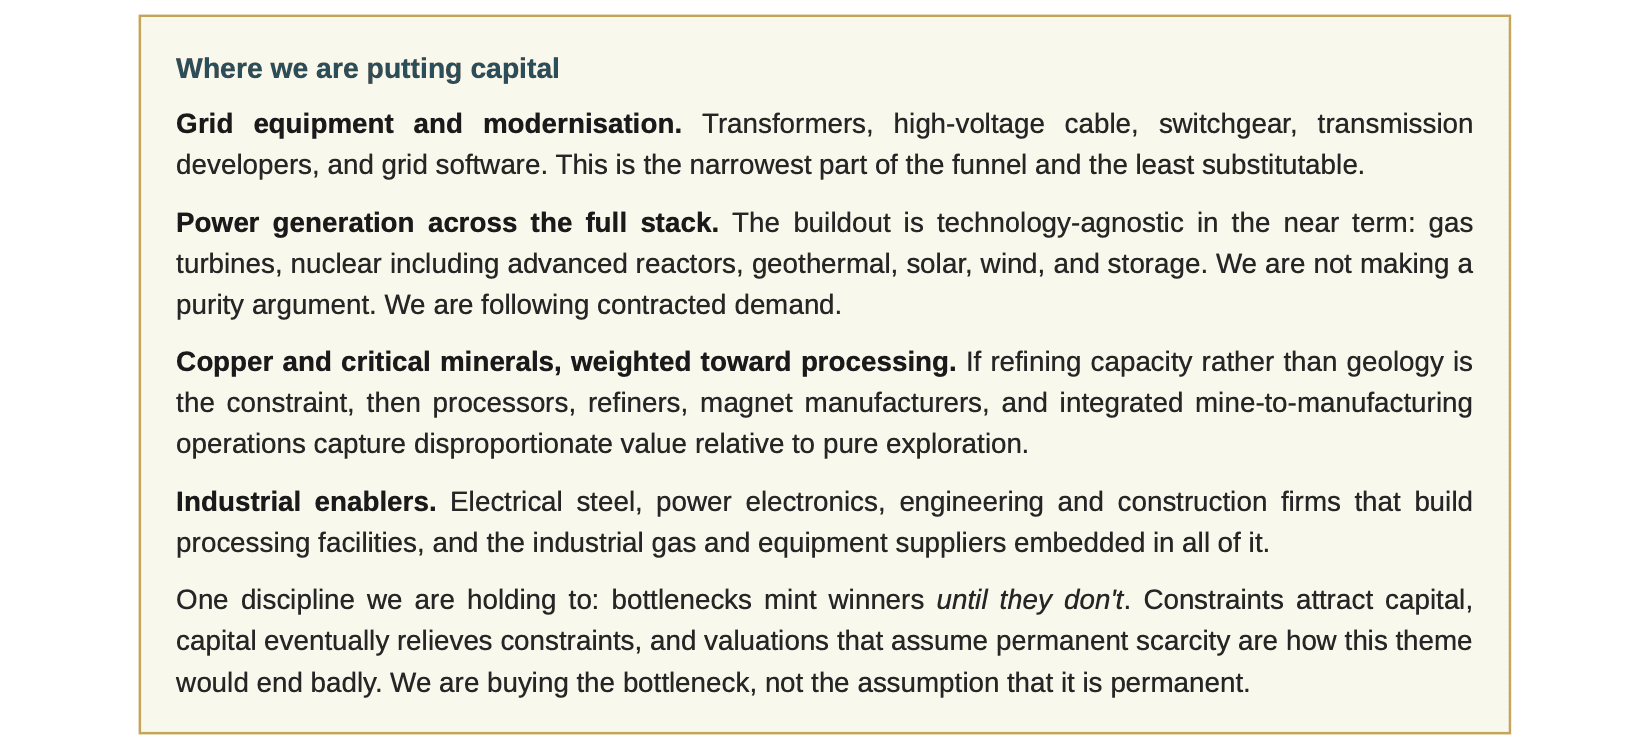
Grid and electrical infrastructure. This is our clearest structural opportunity, and the one we are actively building.
Power generation, technology-agnostic. Nuclear retains particular appeal as carbon-free base-load requiring no fossil transit route — a combination this year has made considerably more valuable.
Copper, critical minerals, and processing capacity. Constrained by permitting cycles and refining bottlenecks that take years to relieve.
Selective international exposure. Europe and Asia are leading the electrification response and trade at meaningfully lower multiples than the U.S.
Quality companies with pricing power and diversified supply chains. The consistent lesson of both quarters this year.
Where We Are Cautious
Peak-cycle energy earnings. Q2 energy earnings grew roughly 135% against a $68 Brent comparison. That comparison does not repeat, and we are wary of extrapolating it.
Concentrated mega-cap technology at full multiples. The AI thesis is sound; the question is how much of it is already in the price. Note that a substantial part of Q2's headline earnings growth came from one-off items at two companies.
Anything priced for permanent scarcity. Applies to memory, to critical minerals, and to grid equipment alike.
Long-duration bonds and highly levered equities while the Fed remains on hold.
Companies with single-jurisdiction dependence on rare-earth processing. The export licensing regime introduced in late 2025 is a live and under-priced risk.
Closing Thoughts
Six months ago the world learned that a 21-mile waterway could halt a fifth of global oil supply. Three months ago it learned that markets recover from such events faster than intuition suggests. Both lessons are worth holding at the same time.
What strikes us most about the first half of 2026 is not the volatility but the speed of adaptation. Nations redrew energy strategy in weeks. Producers withdrew from alliances that had governed supply for decades. Capital rotated into electrification at a pace no climate summit ever produced. Companies signed twenty-year power contracts with oil majors because the grid could not serve them. Whatever one's view of the politics, the direction of travel is not ambiguous.
We have said before that we do not make panicked moves, and we did not make any this year. We did not sell into the March lows, and we did not chase energy after a 70% oil surge. What we have done is methodically build positions in the physical infrastructure that this new economy requires — the grid, the generation, the metals, and the industrial capacity to process them — because we believe that is where the constraint sits and, therefore, where durable returns are most likely to accrue.
The second half will bring a demanding earnings bar, an election, and continued uncertainty about a conflict that has now de-escalated and re-escalated twice. We expect volatility. We do not expect it to change what we own or why we own it.
As always, we are grateful for the trust you place in us. Please reach out to your advisor with any questions, or to discuss how these themes apply to your specific portfolio.
With appreciation,
The Investment Team @ Portola Creek Capital
This newsletter is provided for informational and educational purposes only and does not constitute investment advice, a solicitation, or an offer to buy or sell any security. It does not take into account the investment objectives, financial situation, or particular needs of any individual recipient. The information contained herein has been obtained from sources believed to be reliable, including FactSet, Reuters, Bloomberg, the U.S. Energy Information Administration, the International Energy Agency, WSTS, SEMI, IDC, and contemporaneous financial press reporting, but Portola Creek Capital does not guarantee its accuracy or completeness. References to specific sectors, themes, commodities, or companies are for illustrative and discussion purposes only and do not constitute a recommendation to buy or sell any security. Any companies named are cited as examples of publicly reported industry developments. Portola Creek Capital, its principals, and its clients may hold positions in securities or sectors discussed herein, and those positions may change at any time without notice. Third-party research, analyst estimates, price forecasts, and survey results described in this newsletter are attributed to the institutions that produced them and are reproduced for context only. Their inclusion is not an endorsement, and Portola Creek Capital does not verify or adopt third-party estimates. Analyst estimates change frequently and may have changed since publication. Forward-looking statements are inherently uncertain and depend on geopolitical, policy, and economic developments that cannot be predicted; actual results may differ materially. Index returns shown are total returns unless otherwise noted, are gross of fees, and do not reflect the deduction of advisory fees, transaction costs, or taxes, which would reduce returns. Market indices referenced are unmanaged and not available for direct investment. Charts labelled as approximate trajectories are illustrative reconstructions from reported market data and should not be relied upon as precise price histories. Past performance is not indicative of future results. All investments involve risk, including possible loss of principal. The views expressed herein represent the opinions of Portola Creek Capital's investment team as of the date of publication and are subject to change without notice. Please consult your financial advisor before making any investment decisions.